
Seeing the Unseen: Geospatial Analysis in Home Loan Financing
Home loan financing is one of many areas where geospatial maps can reveal patterns and connections that traditional spreadsheets and tables miss. This use of geographic information system (GIS) maps is particularly timely with the current U.S. administration planning to reinforce a law aimed at stopping lenders from discriminating against racial minorities and the poor.
As part of our new Digital Technologies and Research Unit (DTRU) and existing Performance Improvement Through Capacity Building practice area, ME&A has created sample GIS maps showing how geospatial analysis of loan portfolios can assist financial institutions in establishing a continuous review process to ensure that borrowers are treated in a fair and non-discriminatory manner and all segments of delineated communities are appropriately served.
Click to enlarge
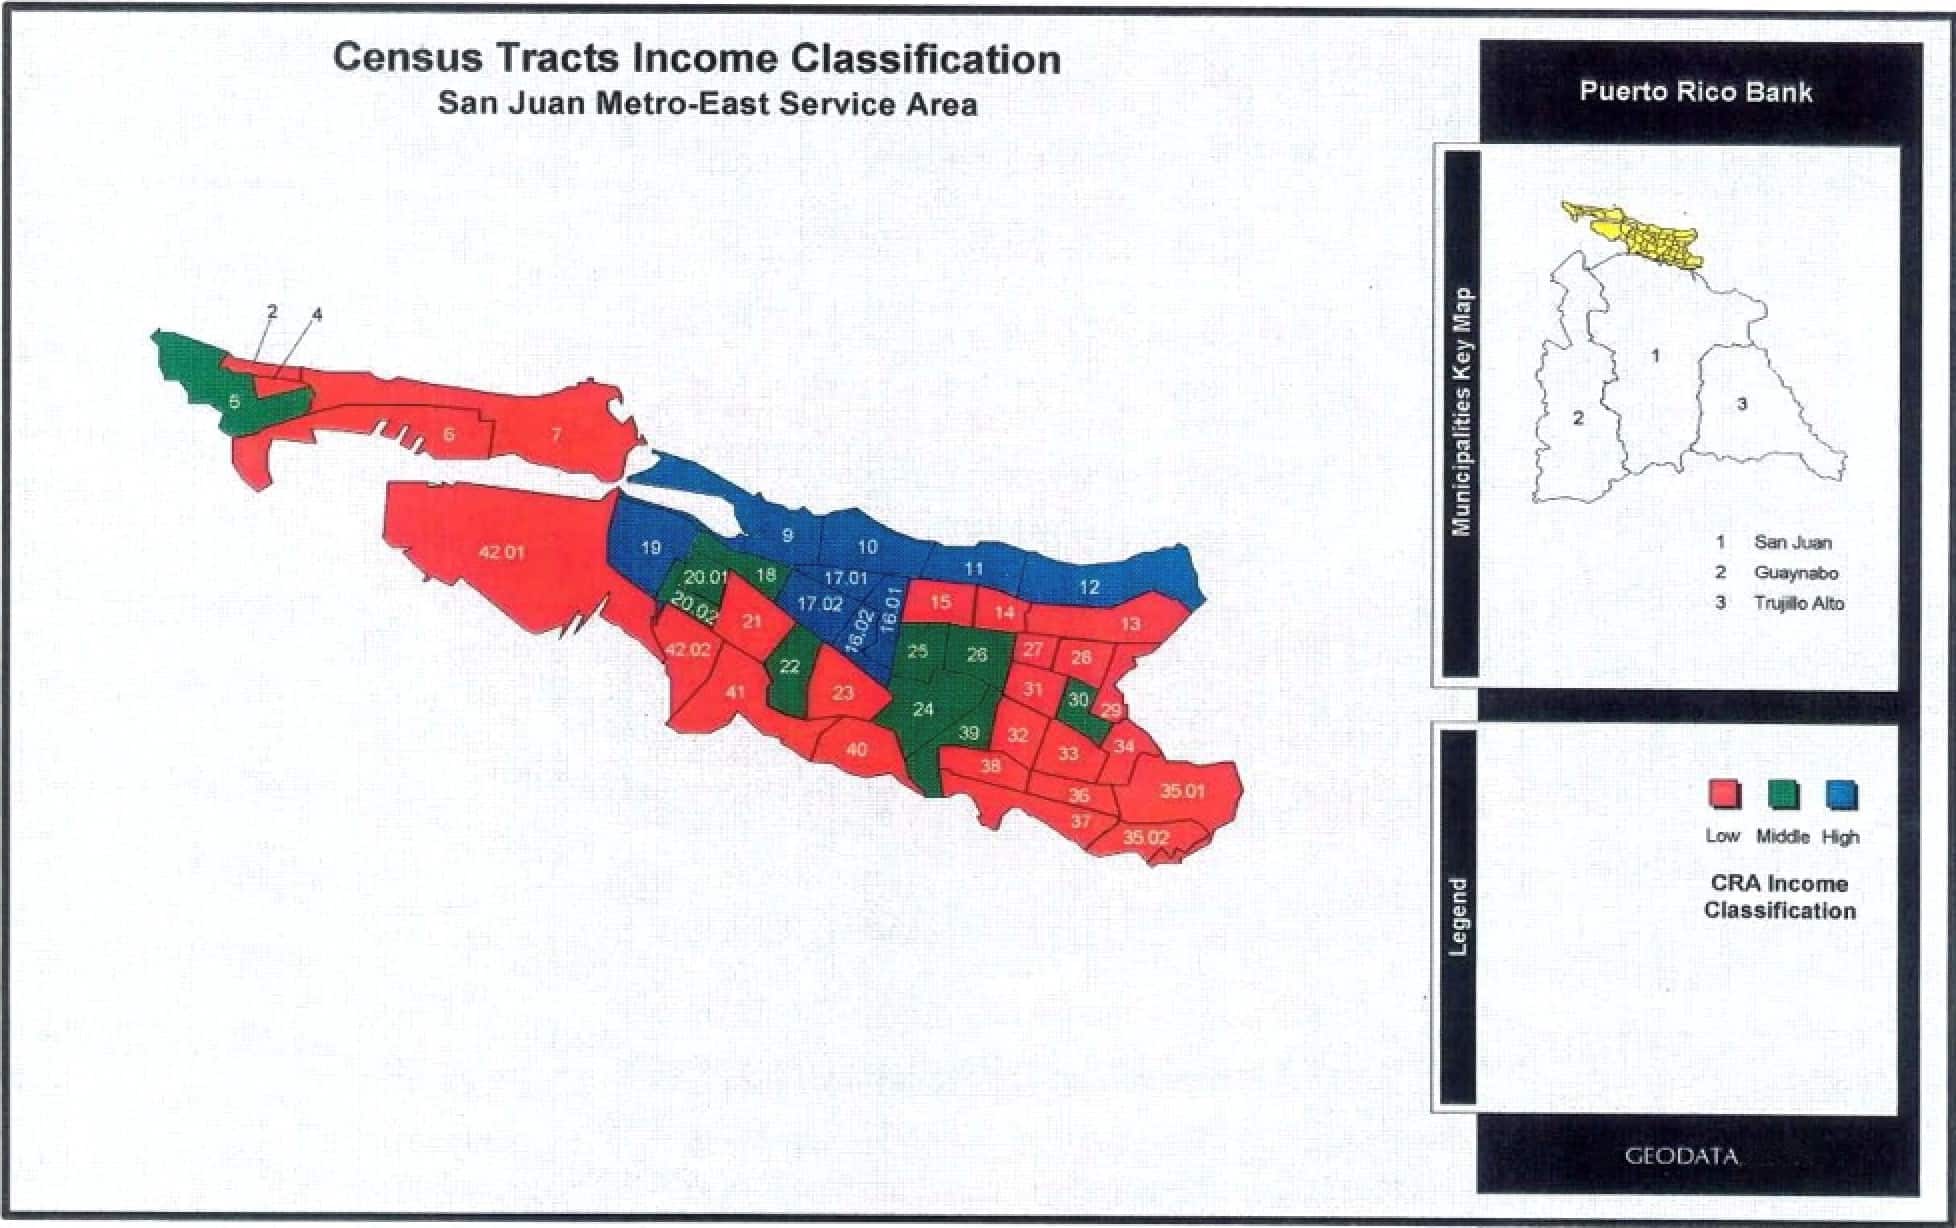
The map to the right shows a portion of the Metro-East Service Area in San Juan, Puerto Rico, which is comprised of three metropolitan area municipalities. This shows the first step required to conduct the compliance analysis for reporting. It basically divides the area into census tracks classified and color-coded into low (red), moderate (green), and high-income (blue) populations according to the U.S. Bureau of the Census.
This map was developed as a cartographic base in a digital format to conduct further analyses and produce other thematic maps for compliance reporting as well as for other purposes, such as loan activity and marketing among others. When using this map in digital format, additional demographic information, such as specific data on population like total persons, families, homes, income level, schools, breakdown by gender and age, etc., can be obtained by clicking in each of the census tracts polygons.
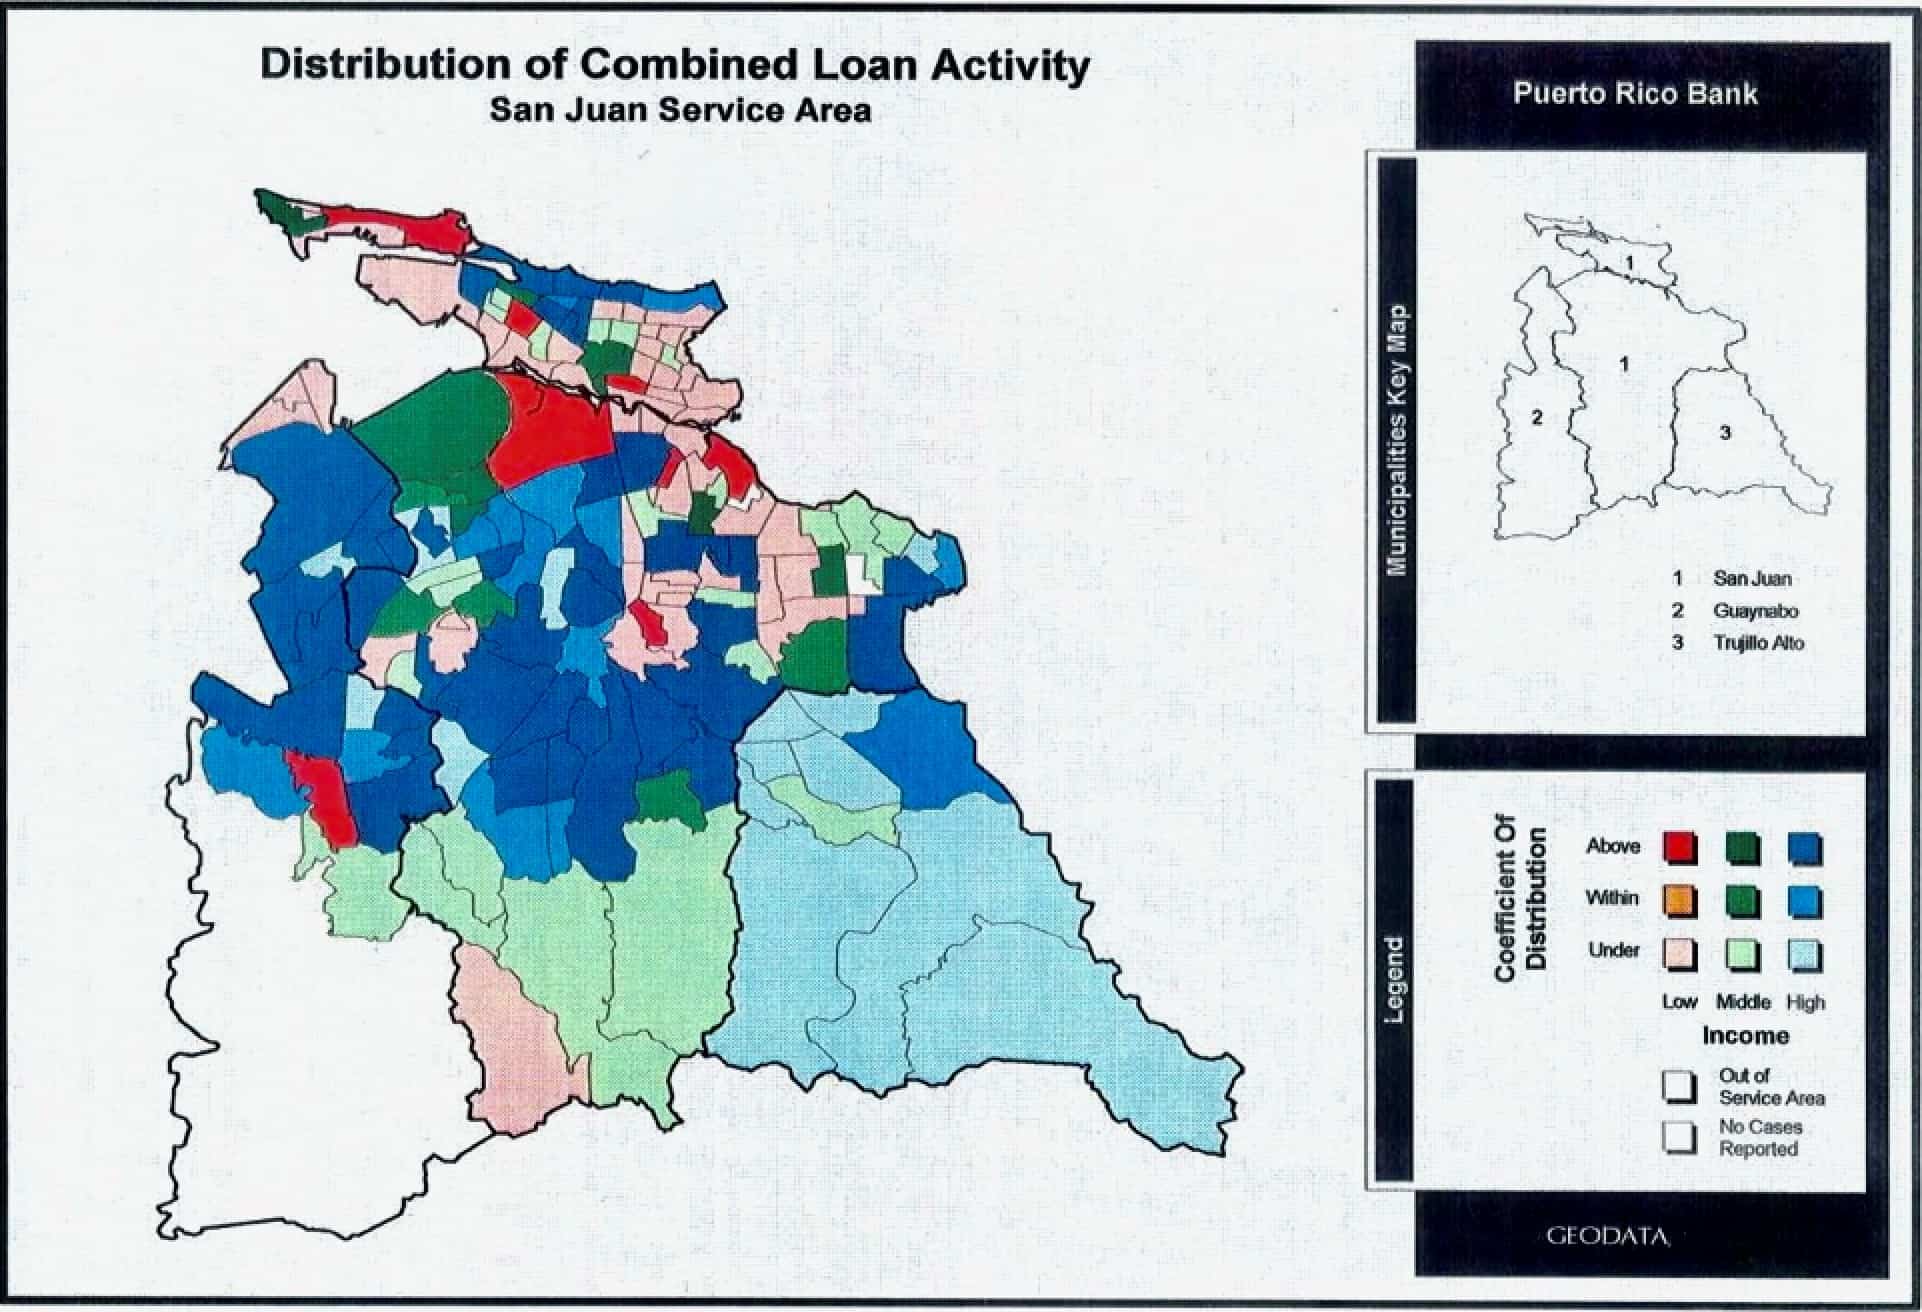
Once the initial cartographic database like the one shown in the previous map is in place, the second step is to add the bank’s information pertaining to loans. The thematic map above shows the outcome of the analysis after applying this type of data to display the distribution of combined loan activity in the service area. Looking at the two maps together helps decision-makers see the previously unseen and begin assessing what is happening and why and how to ensure compliance moving forward.
This is another example of the effective use of geospatial analysis in analyzing land use activities both domestically and internationally.
- About the Author
- Latest Posts

Carlos L. Beale Caballero, Senior Vice President, heads ME&A’s Governance, Democracy, and Public Administration practice. He brings to ME&A more than 30 years of experience in democracy and governance, economic development, urban planning, municipal management, and Geographic Information Systems in Puerto Rico and countries around the world.