
09 Jul Esri Conference Features ME&A-Produced Maps on Guatemalan Mayan Communities
At the 2022 Esri User Conference, the largest global event about geographic information system (GIS) technology, a GIS map created under the ME&A-led, US Government-funded Monitoring, Evaluation and Learning Project in El Salvador (MELI) is being showcased at the annual event for the second time. A second related map created under ME&A’s Geospatial Technology Group (GTG) is being featured as well. The ME&A-produced maps focus on socioeconomic challenges facing the Mayan population in Guatemala leading them to abandon their native lands in search of better opportunities. In 2019, the conference featured three maps produced under MELI related to biodiversity, homicide rates, and the number of Salvadoran returnees from Mexico for the years 2016 and 2018. Many of the more than 300 GIS maps MELI produced were created at the request of the U.S. Ambassador to El Salvador and some were presented at U.S. Department of State hearings before Congress. ME&A was the prime contractor for the MELI Project (2016 to 2022) providing US Government mission in El Salvador and other US Government missions in the region extensive monitoring, evaluation, and learning (ME&L) services. One key to ME&A’s success enabling US Government missions to make data-informed decisions is integrating geospatial techniques into ME&L activities. In recent years, ME&A also integrated GIS into US Government-funded ME&L and natural resources management projects in Albania, Armenia, Rwanda, and Tanzania. ME&A’s GTG provides geospatial services to ME&A’s clients as well as training and capacity-building within ME&A to build ME&A teams’ understanding of GIS and its uses in development.
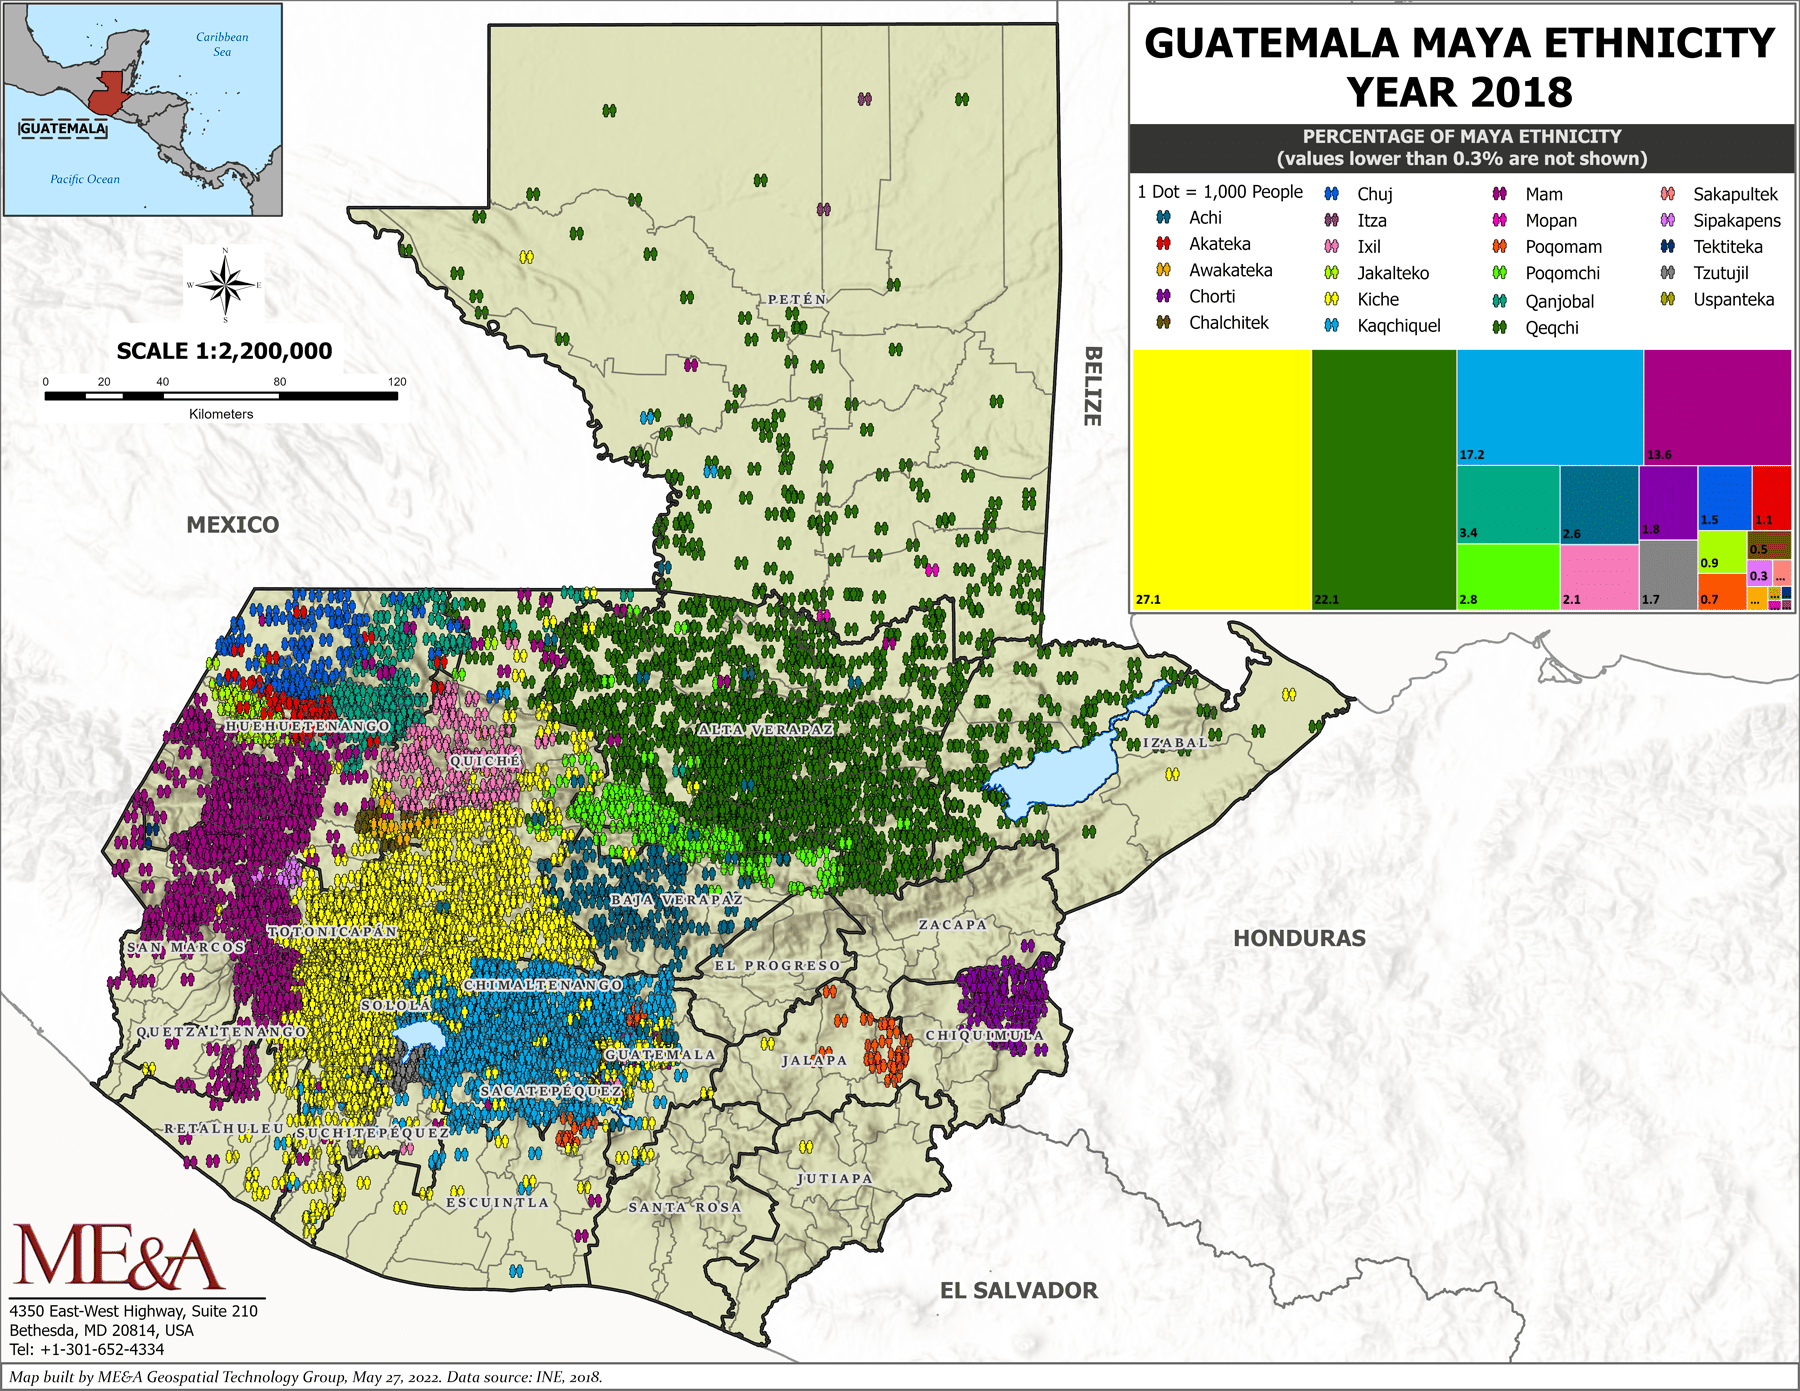
Guatemala Maya Ethnicity Year 2018. Please click on image to view expandable high-resolution version.
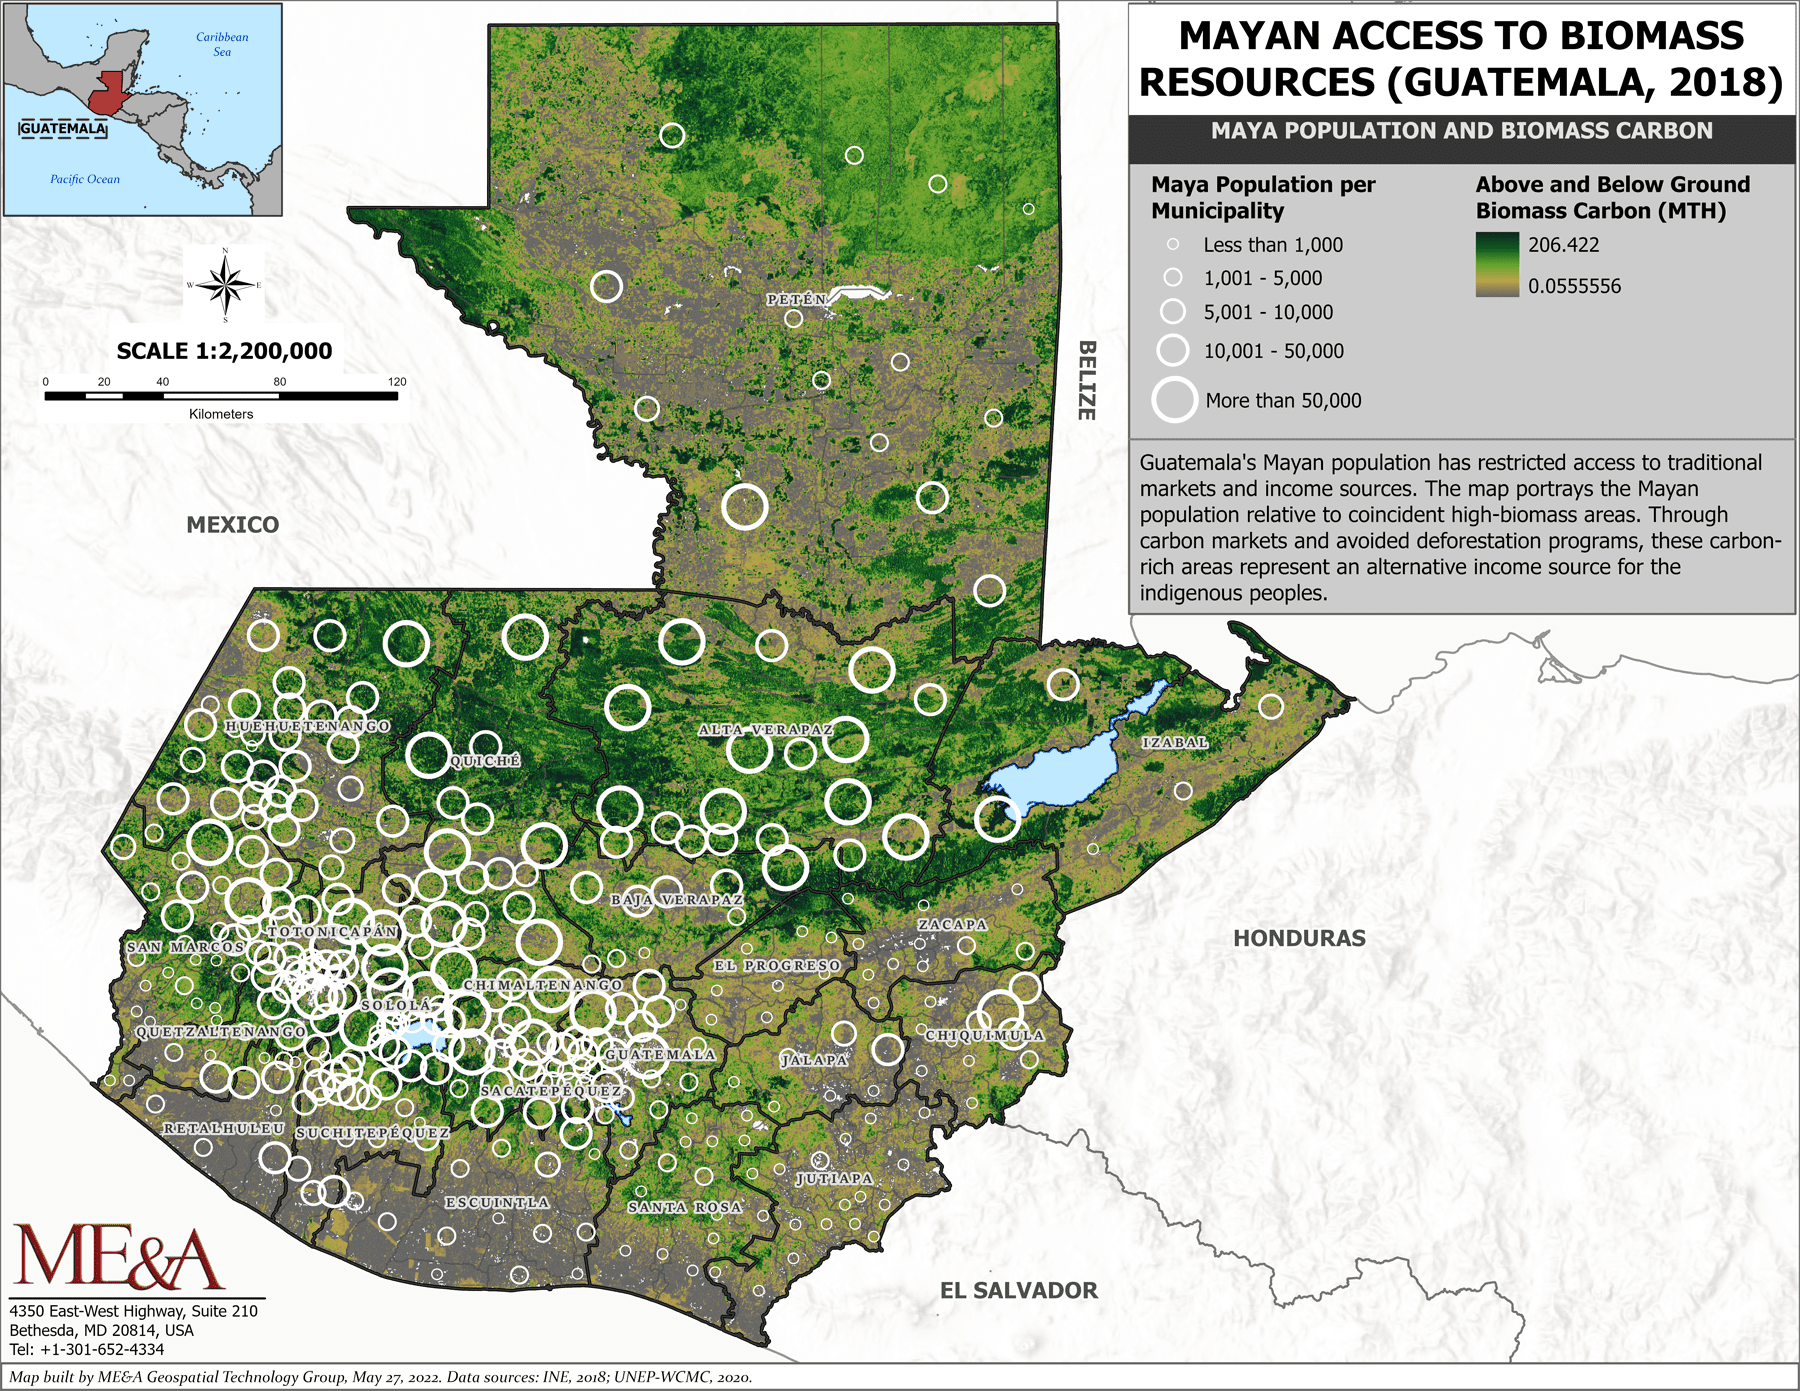
Mayan Access to Biomass Resources (Guatemala, 2018). Please click on image to view expandable high-resolution version.
Background
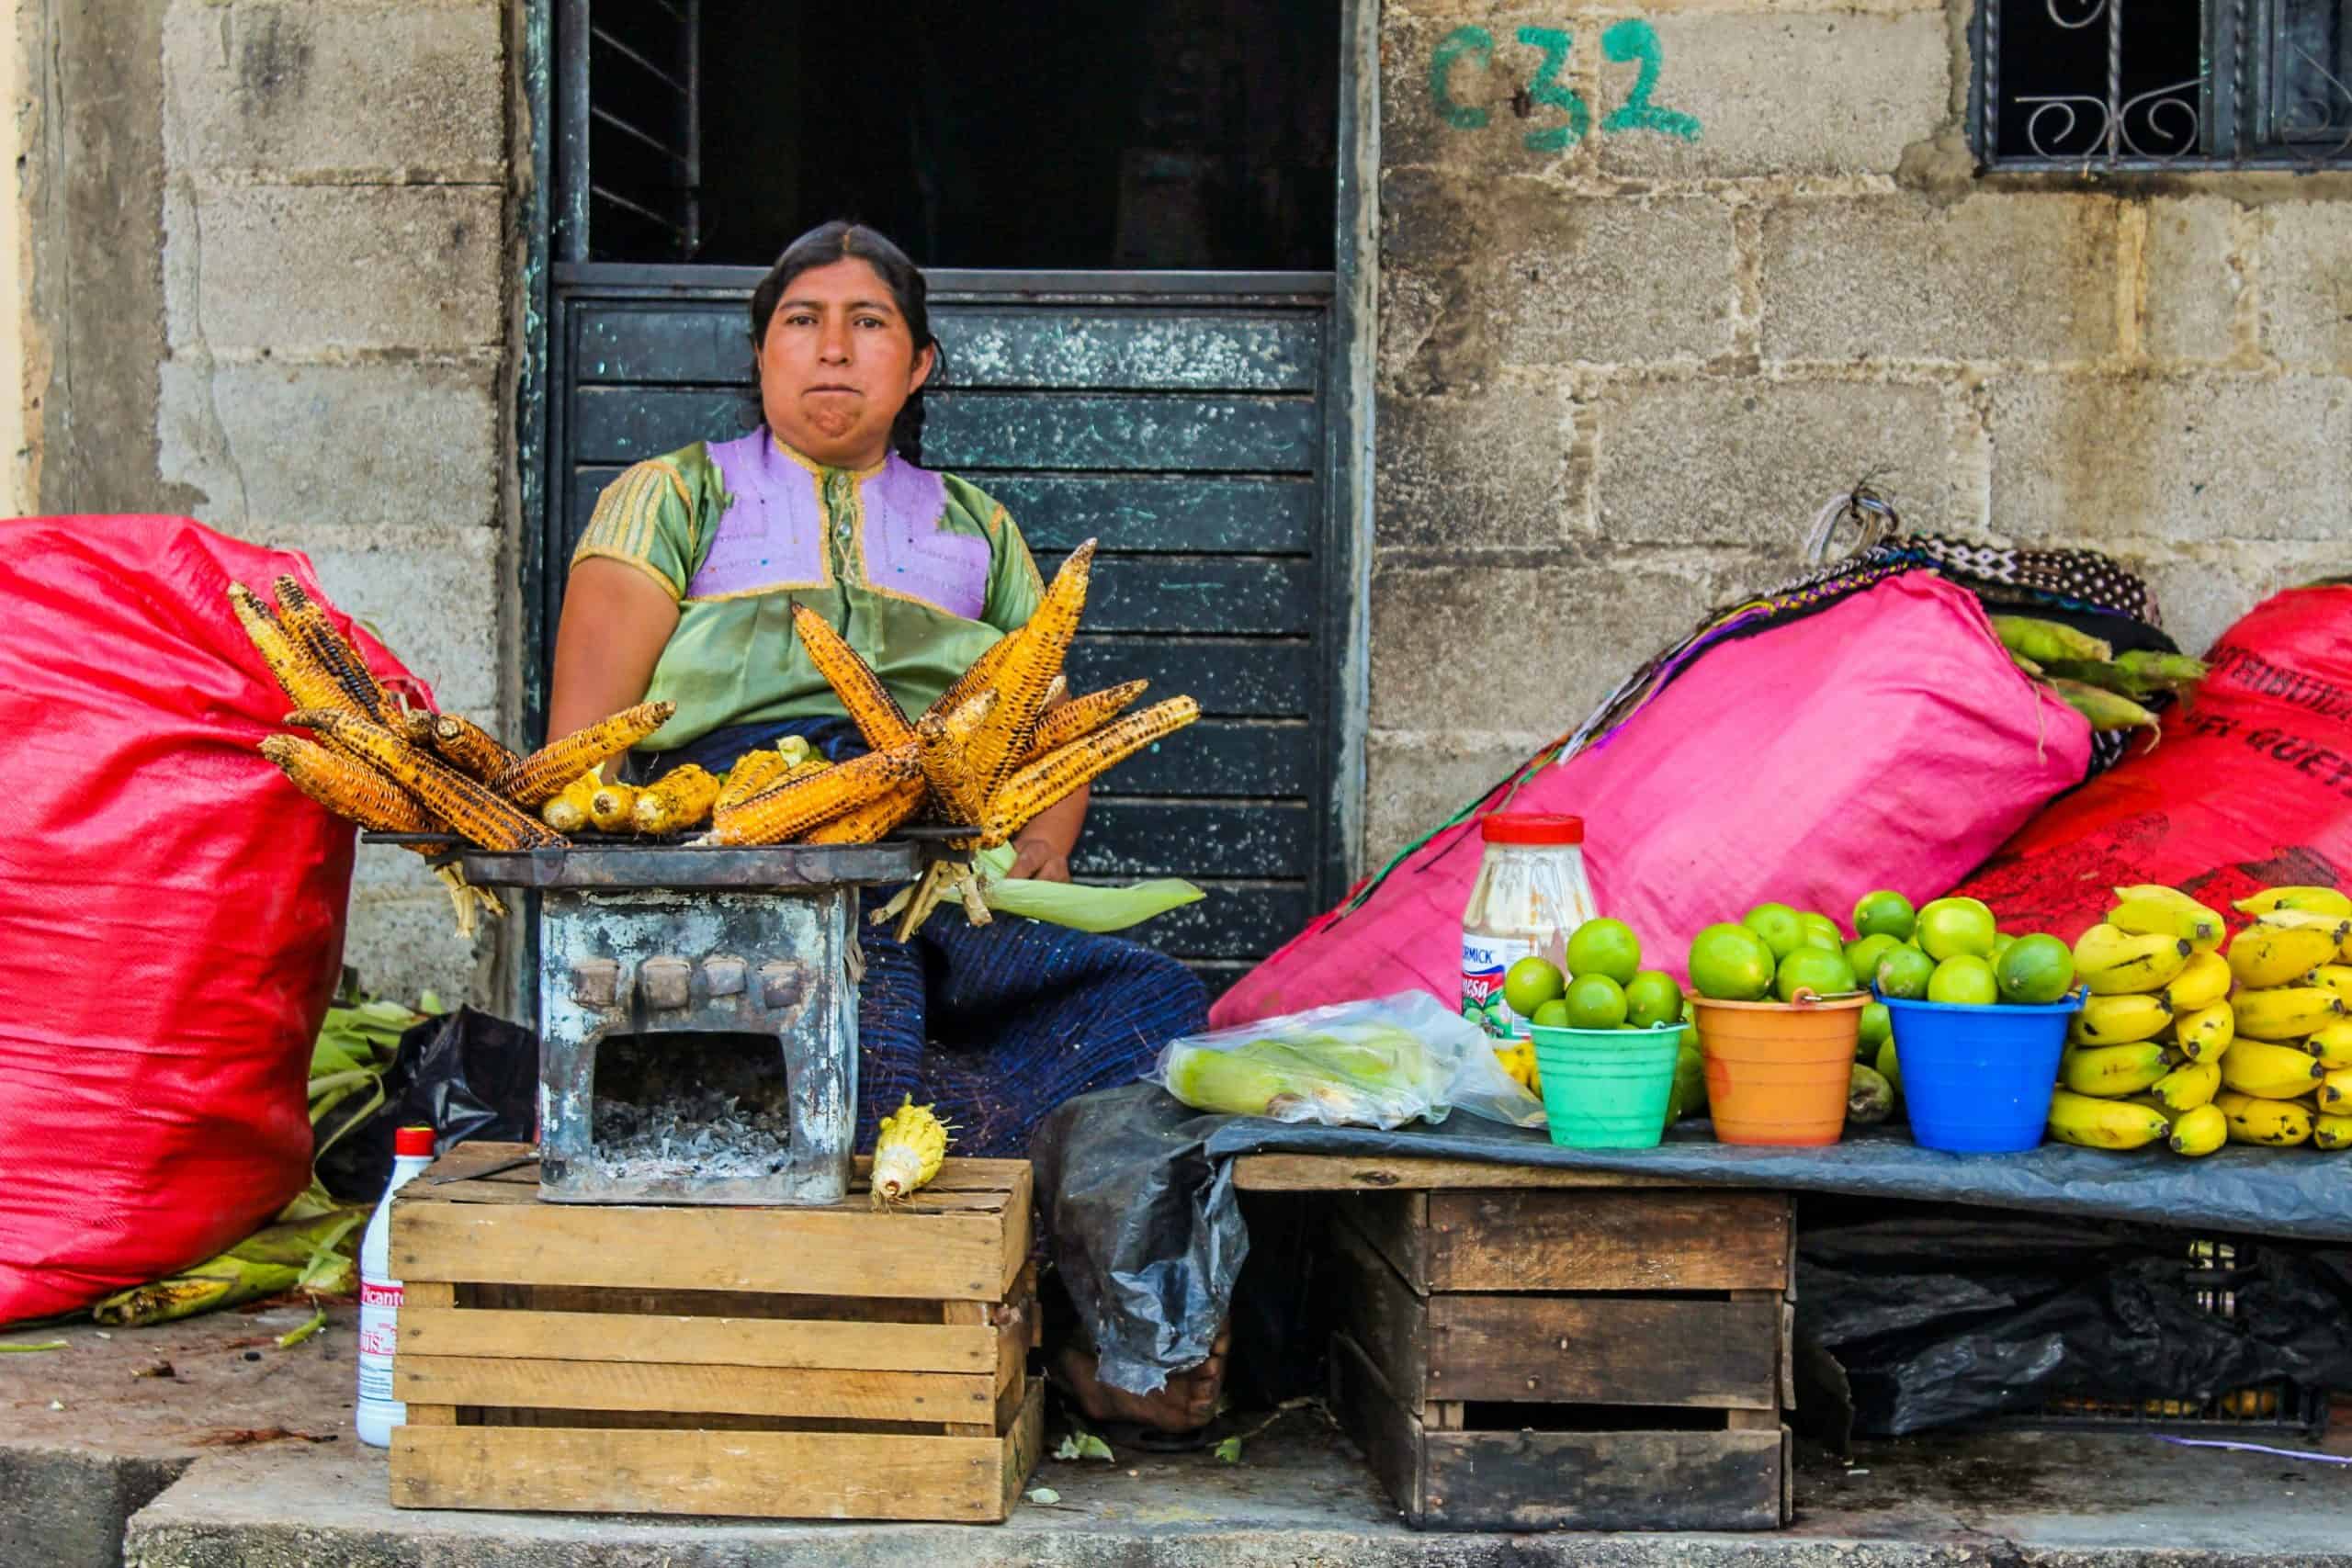
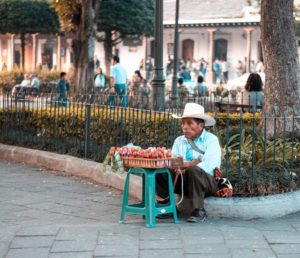
The Mayan population in Guatemala faces numerous socioeconomic challenges threatening their livelihood and prompting many to abandon their native lands for better opportunities. These challenges include discrimination, narcotrafficking, encroachment of housing/industrial development, lack of job opportunities, crime and violence, poverty, food insecurity, inadequate healthcare, and lack of arable land for farming. Today, the Mayan population is considered one of the most vulnerable in Guatemala. That is the main reason US Government missions is interested in sustainable development efforts to provide them with opportunities to improve their livelihoods and lessen the need for them to flee their native lands. MELI assisted US Government missions with analyzing the variables making the Mayan people vulnerable and influencing their decision to migrate irregularly from Guatemala to neighboring countries, including Mexico and the United States. This type of analyses enables more sustainable, data-driven US Government missions investments targeting areas of highest concern. After MELI provided geospatial services for over a year and a half (2020-2022) for US Government mission in Guatemala supporting the analysis of irregular migration in northern Central America, attention turned to developing an approach for analyzing the vulnerability of the Mayan population in Guatemala specifically. We developed a territorial approach as a case study to analyze Mayan vulnerabilities and understand the variables influencing Mayans to decide to migrate irregularly out of Guatemala. By using layers at the municipal level of environmental and socioeconomic factors, we assessed the distribution of the Mayan population’s vulnerabilities.
Variables Used

The Mayan population in Guatemala faces numerous socioeconomic challenges.
- Guatemala Mayan Population Rate. The baseline of this case study is the Mayan population in Guatemala, including the diversity of Mayan ethnic groups. Data includes the number of Mayan population rate per 1,000 habitants. Mayan population reported by the National Census of Guatemala (INE 2018).
- Guatemala Drought Threat (2002 Model). This layer shows the projection of drought threat at the municipality level, published by the Ministry of Agriculture, Livestock, and Food of Guatemala in the document “Threat Estimate to Hydrometeorological Events in the Republic of Guatemala” (MAGA 2002).
- ESRI Land Cover (2021). This layer was used to extract the most up-to-date tree and crop land coverage based on Karra, Kontgis, et al. “Global land use/land cover with Sentinel-2 and deep learning.” IGARSS 2021-2021 IEEE International Geoscience and Remote Sensing Symposium. IEEE, 2021.
- Global Man-Made Impervious Surfaces (GMIS). The GMIS Dataset from Landsat consists of global estimates of fractional impervious cover derived from the Global Land Survey (GLS) Landsat dataset for the target year 2010. The layer was developed by SRI-NASA (2020).
- Guatemala Urban Areas. This layer was built by an interpolation process of urban areas and municipalities of Guatemala to define the highest population areas at the municipality level. The municipality limits layer was obtained from the IDEG GIS Outlook (2021), and urban areas were obtained from the Global Human Settlement Layer – GHSL (Florczyk, Aneta J.; Corbane, Christina; Ehrlich, Daniele; Freire, Sergio; Kemper, Thomas; Maffenini, Luca; Melchiorri, Michele; Pesaresi, Martina; Politis, Panagiotis; Schiavina, Marcello; Sabo, Filip; Zanchetta, Luigi (2019): GHSL Data Package 2019, Publications Office of the European Union, Luxembourg. DOI: 10.2760/0726)
- Municipality Food Insecurity. This layer, developed by the Famine Early Warning System Network (FEWS NET), is a result of the analyzing the factors such as markets and trade, agroclimatology, livelihoods, and nutrition that influence the food security (FEWS NET 2022). The Municipality Food Insecurity is informed by the FEWS NET’s Food Security Outlook. We used the projection for the period February to May 2018.
- Homicides and Extortions. These layers were used as indicators of crime and violence. Data includes homicides and extortions rates per 100,000 habitants, reported by the Guatemalan Police Corp for 2018. Obtained from the INE website (2021).
ME&A’s GTG also created a poster shown at the conference summarizing the GIS analyses and findings, including text on the five municipalities of greatest need and possible interventions.
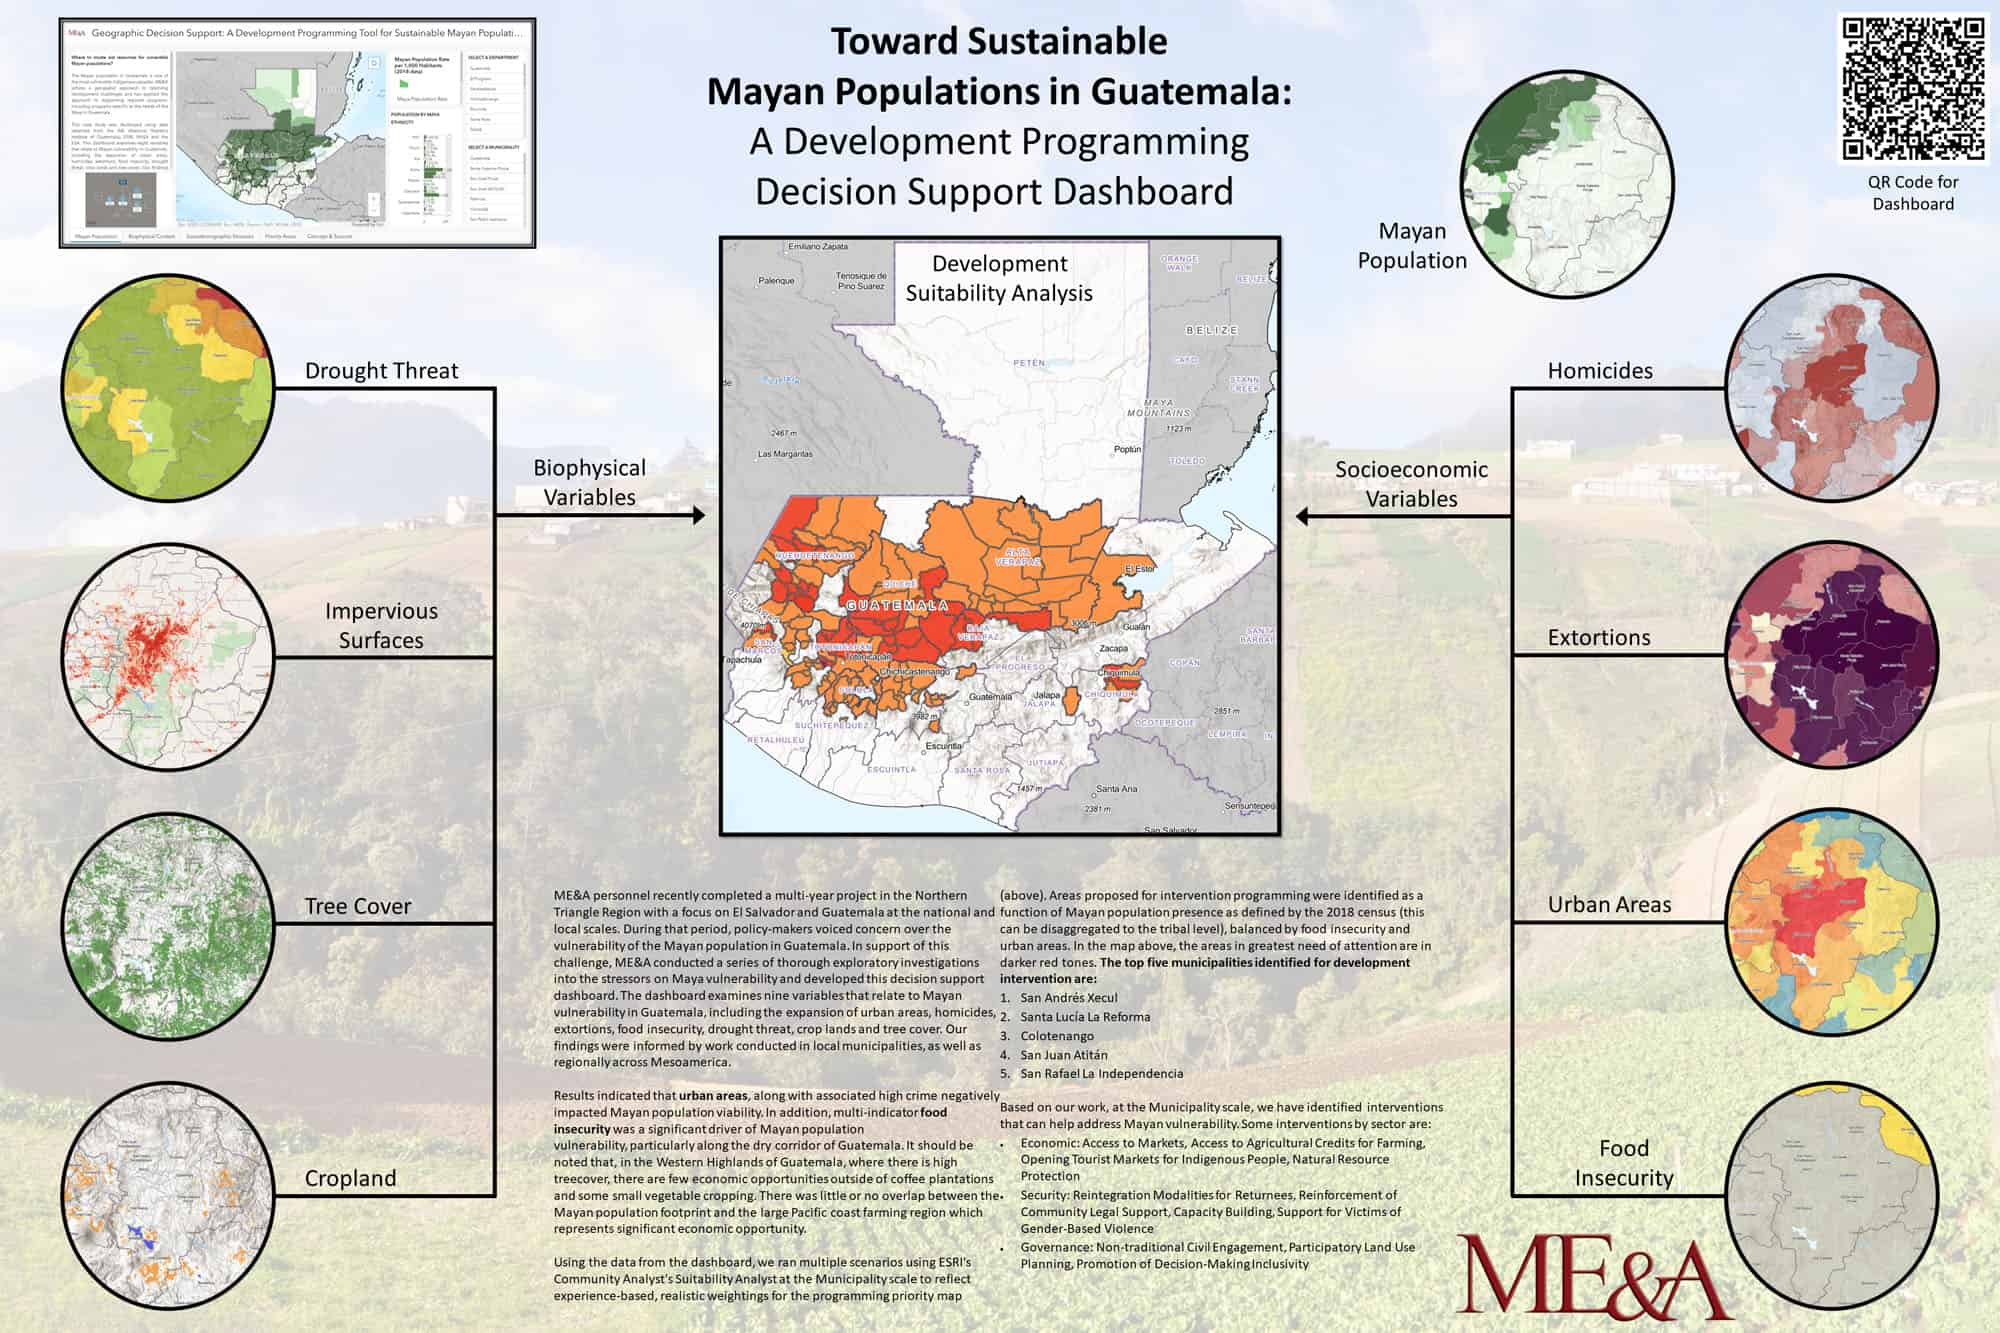
Toward Sustainable Mayan Populations in Guatemala: Development Programming Decision Support Dashboard Poster. Please click on image to view expandable high-resolution version.
Analyses and Findings
Food insecurity is a major variable compelling Mayans to move.